Mass appeal of tea, coffee resonate across RTD beverages
RFG orange juice, fruit drinks and lemonade stars of the show.
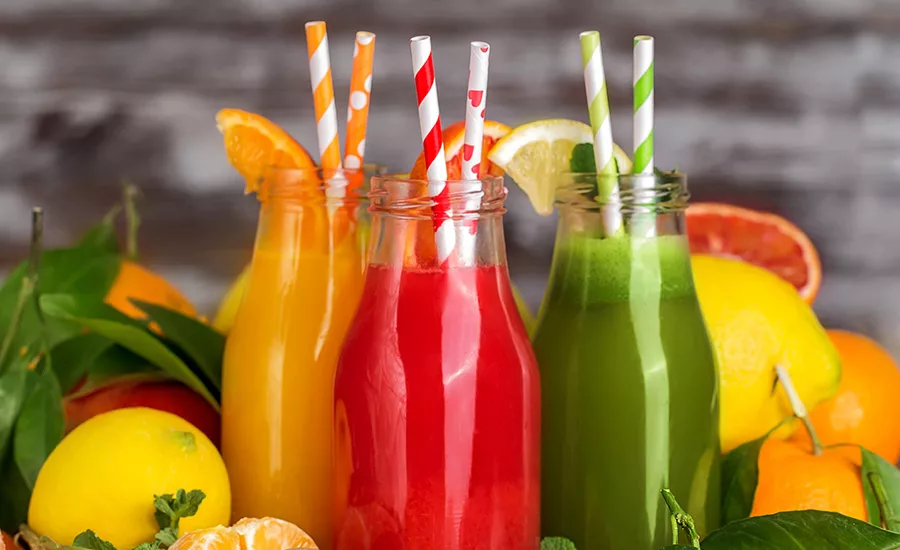
Beverage manufacturers are introducing a wide range of flavors and introducing sugar-free fruit juices to cater to the expanding “healthy living” consumer base.
Photo courtesy of Balchem
In 1959’s “The Sound of Music,” Governess Maria (Julie Andrews) teaches the Von Trapp children how to sing "Do-Re-Mi." From the first strains all the way to “T,” the music scale’s highest note, in “Tea, a drink with jam and bread,” the youngsters learn how to sing “a million different tunes by mixing up the notes.”
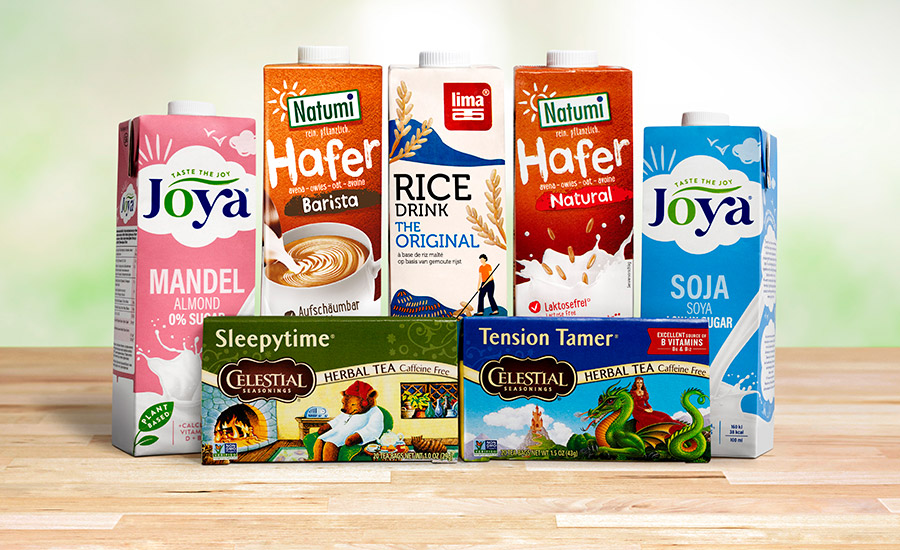
Among the non-dairy beverage categories striving to “hit the high notes” and “mix things up” are the ready-to-drink (RTD) tea and coffee categories which offer a plethora of options for every style and taste, including bottled, loose-leaf, hot, iced and cold brew.
Tea is the most widely consumed beverage in the world next to water, and can be found in almost 80% of all U.S. households. On any given day, more than 159 million Americans are drinking tea, according to the New York-based Tea Association of the U.S.A. Inc. In 2021, Americans consumed almost 85 billion servings of tea, or more than 3.9 billion gallons. About 84% of all tea consumed
was black tea, 15% was green tea, and the small remaining amount was oolong, white, and dark tea, the association says.
“As consumers become more health-conscious, there is a shift away from carbonated soft drinks with high sugar content and artificial additives toward natural fruit juices. This trend is driven by the desire for nutrient-dense and wholesome options that offer vitamins, minerals and antioxidants.”
— A report from Dublin, Ireland-based Research and Markets
Chicago-based market research firm Circana reports that RTD tea/coffee generated $8.3 billion in dollar sales in total U.S. multi-outlets and convenience stores for the 52 weeks ending Aug. 13. Units, however, dipped by 4.7%. When looking at the subcategories, top-selling canned and bottled tea saw a year-over-year (YoY) increase of 6.4% and sales of $4.5 billion, eclipsing cappuccino/iced coffee by a little less than $1 billion; though dollar sales of cappuccino/iced coffee rose 9.7% to nearly $3.6 billion.
Albeit from a much smaller base, cold brew and kombucha recorded downward trajectories of 33.5% and 28.9%, respectively, and dollar sales of $194 million and $8.9 million.
RFG teas and RFG RTD coffee sales jumped 9.4% and nearly 11%, respectively, to $1.5 billion and $1.07 billion in dollar sales.
On the juice side, RFG juices/drinks had a slight 0.5% decrease in YoY sales, still notching a respectable $7.8 billion in dollar sales for the 52 weeks ending Aug. 13, Circana data indicates. Yet, like many categories, overall unit sales declined 8.4% to 2.2 billion.
Of the 20 subcategories within RFG juices and drinks, the Top 3 orange juice, fruit drinks, and lemonade shone brightly with $3.2 billion (-2.1%), $1.4 billion (6.5%), and $1.2 billion (4.4%), respectively, in dollar sales. Unit sales, however, continued their downward spiral in the majority of subcategories with the exception of apple juice (0.1%), fruit juice, all other (5.5%), and lime/lemon juice (13.9%).
Chicago-based SPINS LLC, a wellness-focused data technology company, noted that coconut water and plant water are the only subcategories growing in both dollar sales, $88 million (16.1%), and unit sales, 15,050,471 (12.8%) for the 52 weeks ending Aug. 13.
“Coconut water’s popularity can be attributed to the growing fitness industry and consumers looking to up their hydration with beverages that don’t contain added sugars or artificial colors,” SPINS’ Chief Marketing Officer Dan Buckstaff says.
What sells more — RFG RTD tea or RFG RTD coffee?
In a close race, RTD tea generated $1.3 billion in sales (up 10%) versus RTD coffee percolating with dollar sales of $1.1 billion (up 8.7%) for the same timeframe, SPINS data indicates.
The difference in growth between shelf stable and refrigerated RTD coffee and tea is small, but present, Buckstaff adds. “RFG coffee is growing at 8.7% in dollar sales compared to shelf-stable coffee at 7.1%. RFG tea is growing at 10% compared to shelf-stable tea at 6%.”
Fruit, vegetable juices pack on nutrients
According to Dublin, Ireland-based Research and Markets, the global fruit and vegetable juice market is projected to surpass $164 billion by 2028, growing at a CAGR of 6.1% from 2023 to 2028.
“The market is experiencing growth due to changing consumer preferences toward healthier and more natural beverages. As consumers become more health-conscious, there is a shift away from carbonated soft drinks with high sugar content and artificial additives toward natural fruit juices,” the report states. “This trend is driven by the desire for nutrient-dense and wholesome options that offer vitamins, minerals, and antioxidants.”
As a result, beverage manufacturers are introducing a wide range of flavors and producing preservative-free and sugar-free fruit juices to cater to the expanding “healthy living” consumer base.
Fruit juices also are versatile and can be consumed as standalone beverages, used in smoothies and cocktails, or incorporated into recipes. Fruits like oranges, apples, berries, pineapples, mangoes, and grapes give consumers plenty of options to choose from, the report states.
In addition to marketing new juice blends, “packaging innovation, such as convenient single-serve formats and eco-friendly options, enhances consumer convenience and appeal,” Research and Markets says.
Tim White, vice president of sales at Rocket Products Inc., makers of natural fruit concentrates including its Dair-E Lemonade flavor formulation, to Fruit Punch and Orange, notes that the Fenton, Mo.-based company has a broad selection of concentrates with various juice levels.
“In our category, RFG lemonade, we do not see shelf-stable products gaining share of stomach,” White explains. “Seasonality in lemonade [is] not what you’d expect — it performs all year round as evidenced by quarterly sales: 1st 22.5%; 2nd 31.3%; 3rd 30%; and 4th 20.1%.”
White notes that most successful brands in the RFG lemonade category are winning by increasing all commodities volume (ACV), or the total sales of all products in a given store relative to the total sales of all products in a specific region.
Gaining distribution by making the case for small samples sizes also can promote wider market expansion, he says. “Flavors continue to drive dollar sales with Strawberry and Raspberry leading the way, producing 48% of lemonade’s dollar sales.”
With a 21.2% growth — squarely in the middle of the pack —RFG fruit juice, all other subcategory, had dollar sales of $92 million, while another double-digit climber, at 11.5%, was RFG grape juice with sales of $7.3 million, Circana data reports.
Shannon Fitzgerald, marketing manager at Montvale, N.J.-based Balchem, is among the experts who suggest that non-dairy beverages are doing “fairly well, with positive year-over-year growth.” Although fruit drinks, sport drinks, and RTD tea have seen a decline year-to-year, she points out that this is due to sales losses of a few large category players. She notes that “generally, the category trend is an upward projection.”
Citing Nielsen data for the year ending April 22, energy beverages and value-added water have a market size of $6.9 billion and $2.9 billion, respectively, with an EQ two-year compound annual growth rate (CAGR) of 13% and 4.8%, respectively.
“This is significant as beverages with functional claims are outpacing those without,” Fitzgerald relays. “Although fruit drinks have seen a decline, -0.70%, EQ 2-year CAGR, there are pockets of growth opportunity within the category. Again, functional claims are driving growth in the category.”
Angela Getzel, business development director — Taste Beverage at Kerry, Clark, N.J., concurs.
“Performance nutrition (+30%) and energy beverages (+4%) are growing categories over the last year. The ready-to-drink coffee category has seen a 4% decline in units over last year, however emerging and premium brands are growing, taking share from the big players.
“Lack of low-acid packaging capacity has had a negative impact over the last couple of years and keeps impacting the RTD coffee category,” she continues. “Other non-alcoholic beverage categories are also slightly declining, like soft drinks (2%), RTD tea (4%) and juices (6%).”
New product innovation in RTDs
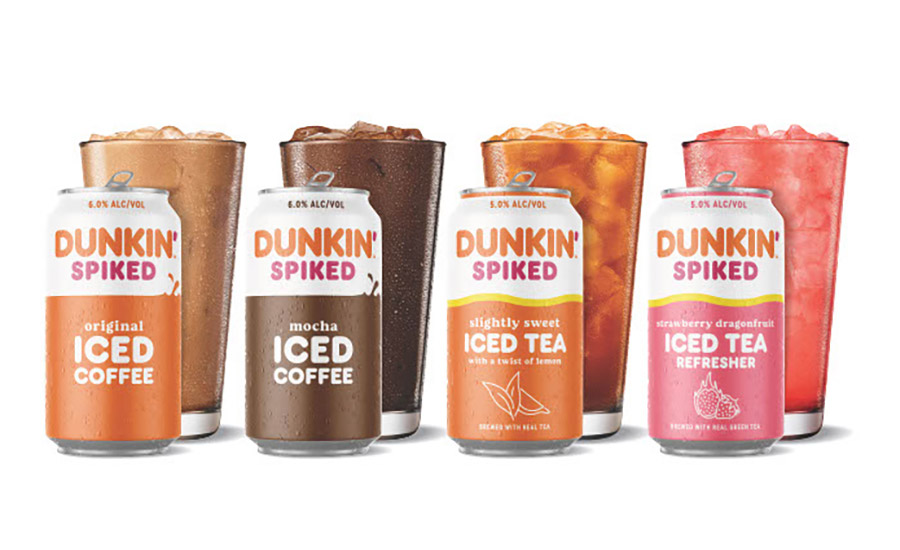
In late August and mid-September, Dunkin’, Canton, Mass., released its boozy spin on fan-favorite Dunkin’ drinks, Dunkin’ Spiked Iced Tea and Dunkin’ Spiked Iced Coffee, respectively, in stores across Connecticut, Delaware, Florida, Maine, Massachusetts, New Hampshire, New Jersey, New York, Ohio, Pennsylvania, Rhode Island, Texas, Vermont, and West Virginia.
Ready-to-drink, day or night, Dunkin’ Spiked Iced Tea is the brand’s first hard tea product and features an alcohol by volume (ABV) of 5% with four signature flavors: Slightly Sweet, Half & Half, Strawberry Dragonfruit Refresher, and Mango Pineapple Refresher.
Drawing inspiration from the brand’s coffee flavors, ’Dunkin’ Spiked Iced Coffee has an ABV of 6% and is available in Original, Caramel, Mocha, and Vanilla.
Dunkin’ Spiked Iced Teas and Dunkin’ Spiked Iced Coffees are flavored malt beverages, which means the source of alcohol is a fermented base made from grain including malted barley, the company says.
“We knew we had the opportunity to create something special when we saw the positive response to our previous seasonal collaborations for Dunkin’-inspired beers. The growing appetite for adult beverages inspired us to put a twist on our customers’ favorite Dunkin’ Iced Coffee, Iced Tea, and Refresher flavors,” says Brian Gilbert, vice president of retail business development at Dunkin’.
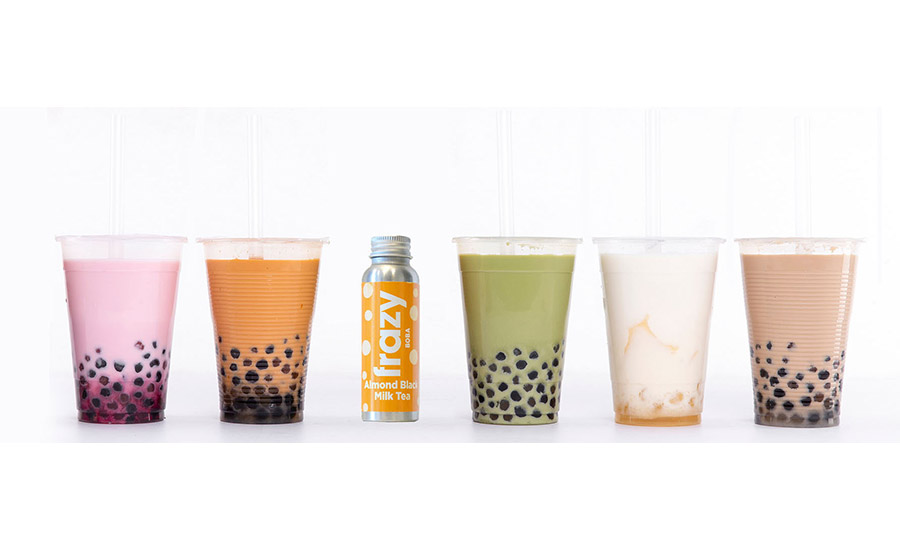
Unique in its packaging and delivery, San Jose, Calif.-based Frazy, a café quality custom beverage startup, added Frazy Boba Tea to their popular Frazy Bottles with six new boba flavors — Peach Black Tea, Mango Black Tea, Brown Sugar Milk Tea, Almond Black Milk Tea, Milk Black Tea and Thai Milk Tea.
Marketed as the “World’s First Highly-Customized Boba Tea,” Frazy Bottles are 2.75-ounce concentrated versions of portable, highly customized specialty boba teas and coffees delivered in compact, shelf-stable bottles sold in six or 12-packs and delivered direct to consumers’ doors.
The shipment comes with vacuum-sealed packets of boba tapioca pearls and milk powder (if applicable). Consumers select and order the type of boba tea they want, the caffeine level, the type of milk (whole, oat, soy, non-dairy creamer, non-fat milk, no milk), sweetness level (sugar, low sugar, no sugar, etc.), and anything else that makes it uniquely theirs — including their name to personalize it further.
Frazy also has introduced 12 new coffee flavors, including holiday favorites like Pumpkin Pie Spice Latte and Gingerbread Latte, and now has 31 SKUs of highly customizable specialty drinks, which includes 24 coffee and six boba tea flavors.
According to an April 2023 report by Precedence Research, bubble tea revenues reached $3.27 billion in 2022 and is anticipated to reach $6.14 billion by 2032, with growth driven by the rising popularity and increase in adoption of healthy beverages such as green tea and black tea.
The flavors of fall
With fall officially here, consumers are seeking warmer, cozier flannel and boots along with more brown, cinnamon-inspired flavors. According to SPINS’ Buckstaff, the following flavors are seeing heightened demand:
- Maple – 452.3% dollar growth, 558% unit growth
- Pumpkin/Pumpkin Spice – 92.3% dollar growth, 72.4% dollar growth
- Matcha – 68.4% dollar growth, 42.4% unit growth
- Banana – 63.7% dollar growth, 52.7% unit growth
- Brown Sugar – 46.7% dollar growth, 51.3% unit growth
- Mocha/Coffee/Cappuccino/Java – 28.5% dollar growth, 5.8% unit growth
Regardless of the season, Sally Lyons Wyatt, executive vice president of CPG Thought Leadership at Circana, notes that coffee experienced historical growth of 6.9% from 2018-2022, reaching $15.7 billion in dollar sales. In 2023, however, there’s was a slight slowdown to 5.3%.
“Like most categories, coffee has experienced a shift to price driven growth particularly in 2022, when pricing increased to double-digit levels after modest increases during the COVID pandemic,” Lyons Wyatt says. “Since 2022, we have a seen a softening of units as pricing increased significantly over the last two years.”
Premium offerings also are driving coffee growth, gaining 3.1 points of share from 2018 to 2022.
“These products offer consumers with coffee shop tastes but at a fraction of the price,” she says. “Mainstream and Value both experienced declines as consumers shift spend to more premium-priced offerings.”
The coffee analyst also is seeing younger consumers (Gen Z), who don’t consume as much traditional hot coffee as older consumers, gravitate toward new experiences (Cold Brew) and new flavor experiences compared to one’s traditional unflavored cup of joe.
“This segment is causing manufacturers to re-think how to drive engagement and innovate around flavor/attributes that appeal to younger consumers,” Lyons Wyatt consults. “Another trend is the impact of social media. Either influencers and/or social causes have spurred growth in segments with the coffee category.”
What drives consumer’s preferences for coffee?
For the second year, Kerry did proprietary research in 2022 to seek North American consumer’s preference regarding coffee flavor and seasonality, about their at-home and away from home consumption, desire, and appeal.
Key insights include:
- Hot coffee is primarily a morning beverage that is part of the morning ritual, while consumption of the remaining types is spread throughout the day as ways to boost energy, on-the-go convenience, and as a treat. Outside energy, coffee drinkers desire immune support (40%) and relaxation (38%).
- The iced coffee category is led by three top consumption occasions: ‘’On the go,’ ‘’Need an energy boost’’ and ‘’It’s too hot.’’
- 51% of Americans prefer flavored coffee a great deal or a lot. Beyond the top four flavors (vanilla, mocha, caramel, hazelnut), each coffee type has a unique top appealing flavor. This brings opportunity to vary and create differentiation in menus or on the shelves.
- The iced coffee beverage category drives different flavor appeal depending on the season. Think of vanilla, turmeric, or chocolate raspberry for spring; maple or pumpkin spice for fall; or peppermint mocha, white chocolate for winter. Each season is bringing its different indulgent moment.
Source: Kerry Proprietary Insights, Coffee Flavor & Seasonality Consumer Research 2022, North America. (Sarah Miller, senior marketing manager – North America Insights)
Looking for a reprint of this article?
From high-res PDFs to custom plaques, order your copy today!


