How should we measure ’milk‘ production?
Measuring solid milk components may produce more accurate numbers
The USDA releases an estimate of milk production for the United States every month, at least during months when the government is operating. Whatever number the USDA releases gets picked up in headlines and plugged into econometric models. Market participants then debate the impact on dairy prices. But does this headline number accurately reflect the production of milk?
What really matters is the production of milk components: protein, fat and other solids. Milk at the farm level in the United States is roughly 87% water, 4% fat, 3.2% protein and 5.8% other solids (mostly lactose). The components, or the solid parts of milk, are what go into various dairy products such as cheese, butter and powders.
Therefore, it is really the production of milk solids that drives the supply of dairy products, but the milk production report doesn’t measure the amount of solids in the milk. The milk-production number that is widely quoted each month is the total pounds of water, fat, protein and other solids that came out of the cows for that month.
You have to do some digging to figure out what actual milk solids production is. USDA does publish a fat content estimate in its monthly “Agricultural Prices” report, but it doesn’t include protein or other solids, so it is an incomplete picture.
The most reliable and consistent source I’ve found are the Federal Milk Marketing Orders (FMMO). All 11 of them publish the data needed to calculate the fat content of the milk, and seven of them publish the needed data to calculate protein and other solids content. It would be better if we had a systematic sampling of the components across the country to make sure the changes in unpooled milk match the changes in milk pooled on federal orders, but the data that we have should be fairly representative of what is happening nationally.
The components in the milk are increasing. Farmers are more and more often paid based on the amount of fat and protein that is in their milk, not on the pounds of water they are producing. So U.S. dairy farmers are selectively breeding for animals with higher component content, and they are also shifting toward breeds such as Jerseys and Holstein-Jersey crossbred animals that produce higher-component milk.
The headline milk production growth number released by USDA is understating the growth in the milk supply most months. Maybe a better way to put it is that the supply of milk solids is growing faster than the headline number we see each month.
Arguably, it’s the fat and protein that really matter. Other solids certainly matter, but they don’t hold back the production of the main dairy products.
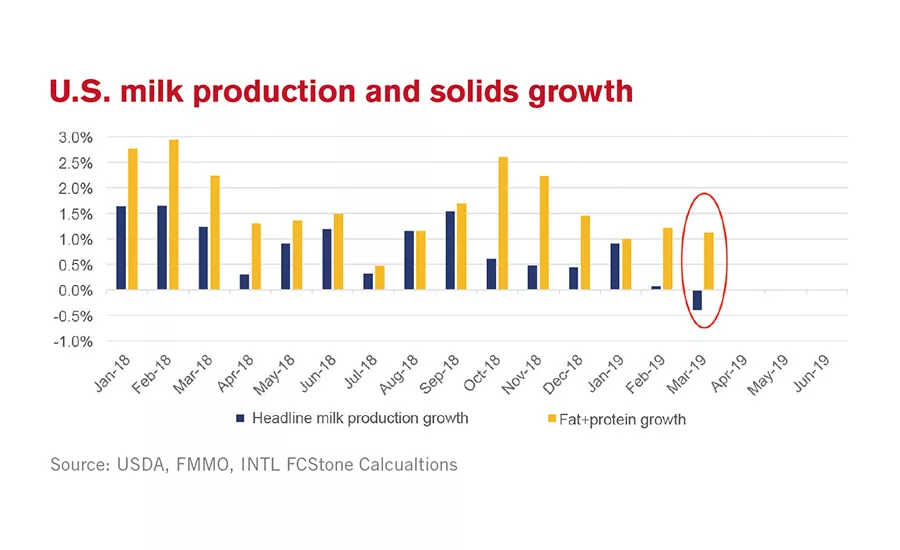
The discrepancy between the headline milk production number and the growth in fat and protein production was very noticeable in March 2019. The USDA estimate for March milk production was down 0.4% from the previous year. But because the amount of fat and protein in that milk is up from last year, the production of fat and protein was actually up 1.1%, which sets a whole different tone for the market.
Looking for a reprint of this article?
From high-res PDFs to custom plaques, order your copy today!


