The consolidations have involved some of the largest dairy product companies in the world, and while the business rationale for these mergers has been varied according to the companies involved, the most common reasons for seeking consolidation include:
- Become more efficient
- Develop and propagate brands
- Gain share-of-market
- Strengthen relationships in the supply chain
The necessity for the industry to become more efficient in logistics and distribution is tremendous. While regarding only one factor, the proliferation of different products, measured by Stock Keeping Units (SKUs) is dramatic.
Even the number of locations where dairy products, in particular ice cream and frozen novelties, can be found has increased. The industry has established distribution in retail chains that now combine groceries and general merchandise, but it has also increased its presence in gasoline stations, convenience stores, shopping malls, hardware stores, factories and video outlets. The thinking behind such efforts is that non-conventional distribution adds to sales volume without cannibalizing sales in existing retail channels.
Dairy products and drinks will have to take advantage of new means of distribution efficiency to reach these outlets, and the volume and variety of the places products are offered means distribution must become highly efficient.
With the increase in locations, number of SKUs, and the increasing presence of consolidation, how much has the industry taken advantage of what efficiency in logistics can provide, particularly when considering distribution efficiency?
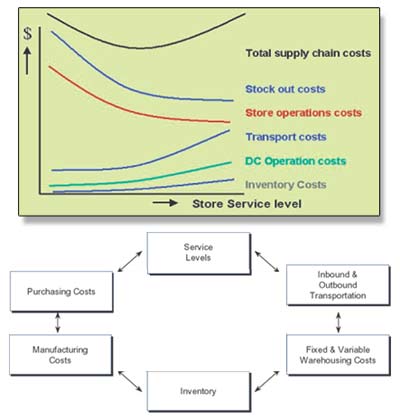
Typical elements that play a role when considering distribution include: Manufacturing and purchasing costs; required service levels, inbound and outbound transportation costs, fixed and variable warehousing costs, and inventory costs.
Figure 1 summarizes the relationships between these elements, with total supply chain costs plotted against store or outlet service costs. As might be expected, as service levels rise, total supply chain costs, transportation costs, distribution center operation costs, and inventory costs also increase. Theoretically, out of stock and per store operations costs would decrease as service levels rise.
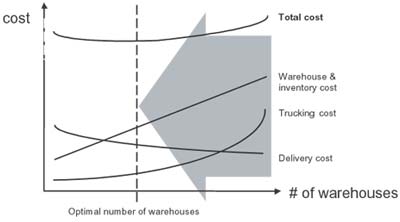
With the possible exception of temporary effects of rising fuel costs from the conflict in the Middle East, the cost of transportation in the dairy industry is currently highly optimized. Transportation has become more efficient due to improved infrastructure, better transportation communication systems and the increased involvement of highly efficient third party logistics providers.
Given this dynamic in the industry, and by adopting more efficient means of product handling and automation within the distribution center, the optimal number of distribution centers is decreasing. Figure 2 shows the relationship between number of warehouses and distribution centers and overall costs.
In a consolidated network, fewer, more efficient distribution centers with a higher throughput would be built. SKUs would be more numerous than single-product distribution facilities, and a higher throughput and volume would be assumed. A higher throughput opens the doors to using automation to reduce operations costs. And if a standardized crate or carton is used, robotics or other labor saving devices can be utilized.
Briefly, orders can be broken down into individual crates of product, and the crates can then be handled as either layers or stacks of crates that comprise a pallet. A pallet would be layers of nine (9) crates, stacks of five (5) crates, with a total pallet of 45 crates, comprising of five, nine-crate layers or nine, five-crate stacks.
1) Buffering in Stack-Product buffered in stacks of five crates. The automated picking of crates and stacks; some manual orderpicking of less-than-crates, outbound shipment on pallets of individual stacks of crates
2) Buffering in Layer-Product buffered in layers of nine crates. The automated picking of layers and rows of crates; some manual orderpicking of crates and less-than-crates, outbound shipment on pallets
3) Buffering in Pallets- Product buffered in pallets of forty-five crates. The automated picking of pallets themselves, depalletizing, to individual stacks for crates, individual manual orderpicking of stacks of crates and less-than-crates, outbound shipment on pallets
Each of these three scenarios would require a unique physical layout and equipment profile, and the rationale for each is dependent upon a detailed analysis of dairy production and distribution parameters including peak activity days and hours, routes and orders per day, destination of orders (direct-to-store or retail distribution center), volume per product shipped per day, and number of orders per SKU. Each scenario is intended to accommodate and function with the most appropriate mix of products, orders and volume found in a typical dairy.
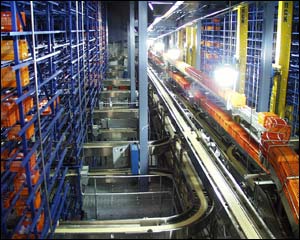
For example, in Solution 1) Buffering in Stack, physical equipment might include a Automated Storage and Retrieval System (AS/RS) with triple deep stack storage of stacks on pallets, consisting of 5,400 stack locations and 27,000 individual crates. Stack creation would involve a robotic gantry picking system that could create 1,800 stack locations and 9,000 individual crates. Manual order picking for less-than-crate quantities might include flow lanes, with pick-to-light systems that would handle approximately 250 SKUs and 195-crate output per hour.
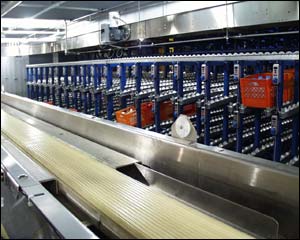
Solution 2) Buffering in Layer, physical equipment might include an triple deep AS/RS for individual crates that would handle three-carton subsets of nine-carton layers, with 8,500 storage locations containing 25,500 crates. Manual orderpicking for single crate and less-than-crate might include flow lanes, with pick-to-light systems that would handle 125 SKUs and 585 crates per hour.
Solution 3) Buffering in Pallets would require bulk pallet storage, retrieval of full pallets from storage, a depalletizing process, and manual orderpicking of crate, stacks and less-than-crates. Manual orderpicking for less-than-case orders for slow movers could be done from static shelves or flow lanes to undriven roller conveyor for takeaway, and medium volume full-case picking could be done from stacks to belt conveyor.
The investment for two larger automated facilities can be the same for three conventional facilities. Automation can reduce the operational costs within the distribution centers by up to 20%, offsetting the premium for primary and secondary transportation, and inventory levels drop due to consolidation of the safety stock. A greater transparency of inventory levels also results from a standard warehouse management system, and there may be greater flexibility resulting from a combined transportation fleet. Traditionally, there is less dependency on labor, and there may even be reductions in the labor required in refrigerated and frozen areas, where labor costs have been high. Products are generally handled more safely with less product damage. Longer shelf life and more accuracy in handling dated products also can result.

