Some dairy plants can’t keep up with growing sales, while others find themselves with excess capacity. Contract manufacturing is proving to be a boon to both.
More than half of respondents to Dairy Foods’ 2017 Contract Manufacturing Survey (55%) said their companies are involved in contract manufacturing. A further breakdown shows that 20% of respondents are solely users of such services; 13% are solely providers; and 23% are both users and providers.
Users driven by more than capacity limitations
Although a third (33%) of user respondents cite capacity limitations as a reason for turning to contract manufacturers (co-packers), it’s not the only reason. For example, 34% of user respondents said they rely on co-packers because they lack the in-house expertise for specific product production. See the chart on this page.
In terms of revenue, co-packed products account for a significant chunk of user companies’ annual sales. More than a quarter (28% mean percentage) of user companies’ annual revenue is attributed to products produced by a co-packer.
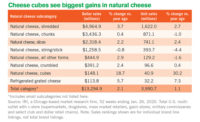
Cheese represents the top product category among contract manufacturing users, with 32% of user respondents indicating that their companies rely on co-packers in this space. Rounding out the top four are ice cream (28%), “other” cultured dairy foods (25%) and non-dairy-based beverages (24%).
Getting help with purchasing, distribution
Product production is not the only service co-packers provide to user respondents. The top four non-production services user respondents said their companies rely on are warehouse and distribution (46%), ingredient purchasing (43%), packaging materials purchasing (41%) and product development (27%). (Respondents could select more than one response.)
Fewer user respondents said their companies are reliant on co-packers for package design and branding (17%), market intelligence (11%) and “other” services (9%).
Meanwhile, more than half of user respondents (57%) said their companies supply their own recipes for co-packed products. A little over a quarter of respondents (26%) said their companies rely on both their own recipes and co-packers’ recipes, while 17% said their companies use only co-packers’ recipes.
On the ingredients side, a little more than half of user respondents (52%) said their companies purchase their own ingredients for co-packed products. Flavors such as cocoa powders and vanilla (54%) and dairy ingredients such as milk powders and whey products (50%) are the components purchased most often by co-packer users.
Co-packers are slightly more likely than not to provide packaging material for the finished product, with 53% of user respondents stating that they use co-packer-recommended packaging materials. The packaging formats user respondents reported purchasing most commonly were paperboard cartons and closures (45%) and cups and lidding (35%).
As for equipment, 33% of user respondents said their companies’ co-packers have purchased equipment specifically for servicing them. And 18% of user respondents said their companies have installed equipment in co-packer facilities to meet company needs.
Filling equipment was the top co-packer-purchased equipment item reported by users (43%). It also was the top user-owned equipment item installed in co-packer plants (59%).
Looking ahead, contract manufacturing will continue to be important to most user respondents. In fact, 35% of them said they expected to increase use of co-packing services in the next 24 months. Only 14% of user respondents said they expect usage to decrease.
Providers produce store brands and more
On the flip side, more than a third (36%) of survey respondents indicated that their companies provide contract manufacturing services. Provider companies are most likely to perform such services for brands that lack their own manufacturing capabilities. For example, more than half of provider respondents (52%) said their companies co-pack for supermarket store brands.
Still, almost a third (30%) of provider respondents indicated that their companies co-pack for established dairy brands that also have their own manufacturing facilities.
And contract manufacturing is big business for some dairy processors. A third (33% mean percentage) of the revenue of provider respondents’ companies is generated from contract manufacturing operations.
Ice cream represents the top product category among co-packing providers, with 35% of provider respondents indicating they are co-packers in this space. Rounding out the top five are fluid milk (34%), cheese (29%), non-dairy-based beverages (26%) and “other” cultured dairy foods (25%).
Full-service partners
In addition to production, the surveyed contract manufacturing providers offer a number of other services to clients. Almost two-thirds (61%) of provider respondents said their companies provide packaging materials purchasing services, while 57% said their companies offer product development services. More than half offer warehouse and distribution capabilities (55%) and ingredient purchasing services (51%).
But only 35% of provider respondents said their companies offer package design and branding services. And less than a quarter of provider respondents (23%) said their companies provide market intelligence such as market share reports and sales forecasts.
In terms of recipe usage, more than half of provider respondents (53%) said their companies rely on both their own and their customers’ recipes. Meanwhile, a quarter (25%) of provider respondents said their companies offer their own recipes to customers, while 22% said their companies use customers’ recipes.
When it comes to ingredient purchases, three-quarters of provider respondents (75%) said their companies purchase ingredients on behalf of co-pack customers. The top four ingredients that provider respondents reported their companies purchasing on behalf of co-pack customers are milk and cream (81%), dairy ingredients such as milk powders and whey products (69%), flavors such as cocoa powders and vanilla (66%) and sweeteners (59%).
Three-fifths (61%) of provider respondents also offer packaging materials for co-pack customers, with paperboard cartons (69%), plastic bottles and caps (46%) and flexible plastics (43%) provided most often.
On the equipment front, almost half (48%) of provider respondents indicated that their companies have purchased equipment specifically to service a co-pack customer. The top five types of equipment purchased were filling equipment (65%), mixers and blenders (43%), processing equipment (30%), cheesemaking equipment (27%) and aseptic filling equipment (19%).
A third (34%) of provider respondents also said their companies have installed co-pack-customer-owned equipment in their own plants to service a co-packed product. Filling equipment ranked highest here, with 35% of provider respondents indicating that their companies installed such customer-owned equipment.
Looking to the future, contract manufacturers expect business to remain brisk. In fact, more than half (55%) of provider respondents said their companies anticipate an increase in contract manufacturing volume during the next 24 months. Only 5% of provider respondents indicated that their companies expect volume to decrease.
The Market Research Division of BNP Media (publisher of Dairy Foods) surveyed Dairy Foods’ magazine and newsletter subscribers between Aug. 10 and Sept. 1, 2017. Of the user respondents, 54% were male and 46% were female. Of the provider respondents, 60% were male and 40% were female. The mean age for both users and providers was 52. Three-quarters (67%) of user respondents and 63% of provider respondents have more than 10 years of industry experience.
Please visit www.clearmarkettrends.com to purchase and download the entire report, as well as access a wide inventory of other studies done in this industry. You can also email us at info@clearmarkettrends.com if you have any questions.


