
42%
That’s the percentage of U.S. consumers who say they rely on the product label as a source for helpful and accurate information about health and wellness.
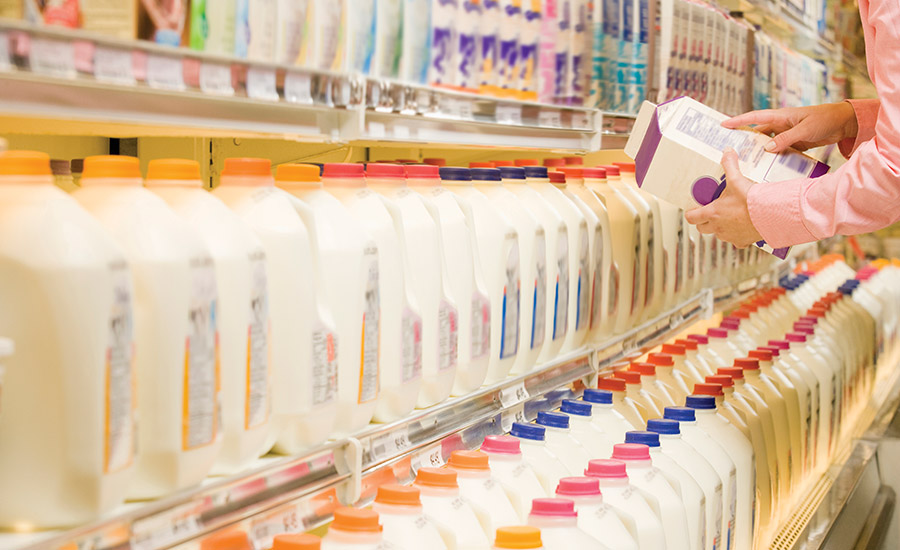
Source: “Health and Wellness 2017,” The Hartman Group, Bellevue, Wash.
65%
That’s the percentage of U.S. consumers who say they look at the product label to see if the food or beverage is “minimally processed.” Some of the key identifiers for a less-processed product are short, pronounceable, recognizable ingredients; ingredients that “make sense” for the product; colors that are appropriate to primary product ingredients; and known “unnecessary” flavoring additions such as sugars and salts appearing low on the ingredient list.
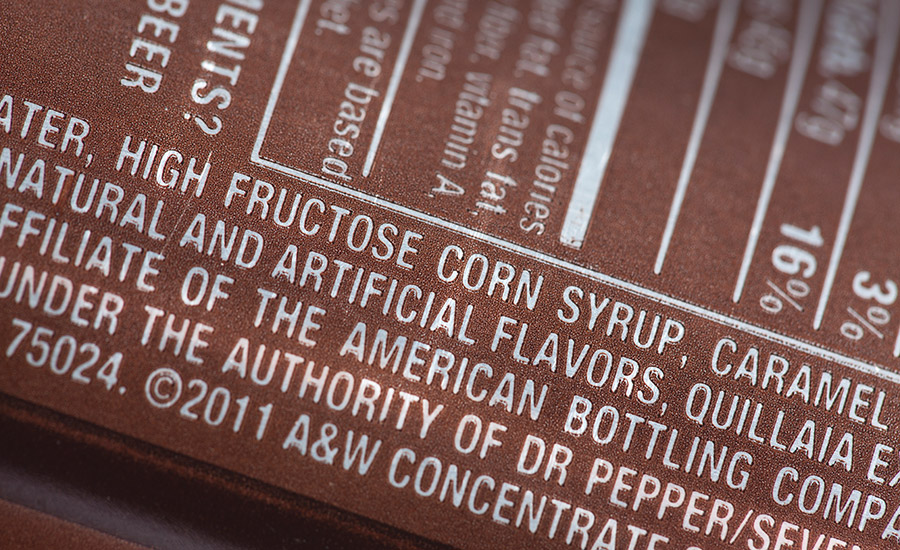
Source: “Health and Wellness 2017,” The Hartman Group, Bellevue, Wash.
8.4%
… is the projected annual growth for the global kefir market from 2017-2025. The health benefits association with consumption of the probiotic drink include improved immunity, increased bone strength, enhanced digestion and reduced risk of osteoporosis and asthma. In 2016, Europe accounted for the largest revenue share, followed by North America.
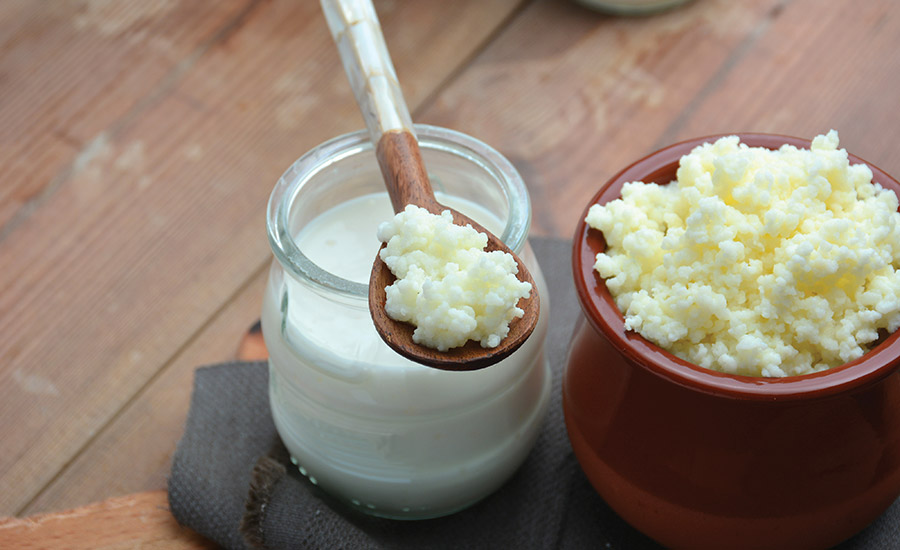
Source: “Global Kefir Market,” November 2017, Coherent Market Insights, Seattle.
$59 billion
That’s the value the global protein ingredients market is projected to reach by 2025. The animal proteins market held over a 75% share of the protein ingredients market in 2016 due to increased consumption of eggs and dairy products globally.
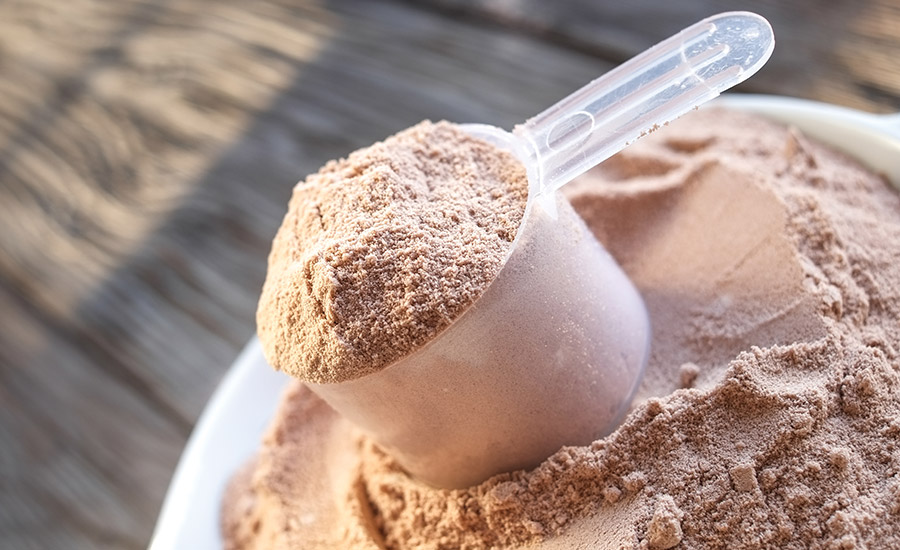
Source: Protein Ingredients Market by Source and Application — Global Industry Analysis and Forecast to 2025,” May 2017, Crystal Market Research, Las Vegas.


